Superheroes and villains in comics are usually supposed to represent what’s good and bad. Thus, the way the character is portrayed will have an influence on the reader. If for example all villains are part of the same minority, people can unconsciously see them in real life as bad people. On the other hand, children can be inspired by heroes and see in them what they could grow up to be. These are just examples that show how influencial comics are on our society, and in some ways they can even be a representation of it.
This made us wonder how do the two biggest comic books publishers, Marvel and DC comics, choose to portray their characters. In other words, we analyzed the representation of the characteristics of comics characters, how diverse they were and if some of them have a higher tendency to survive over time.
We wanted to have as much data as possible to have an accurate analysis. So we built our dataset from:
Marvel Characters
Marvel Comics
DC Characters
DC Comics
This allowed us to collect the attributes of all the characters, but also in what comics and periods of time they appeared in (don't forget to to click on the colored links above to access directly to the database!).
To write this story, we had to make a few choices. Here they are to make things more clear during the analysis.
First, one of the main aspects of this story is to compare Marvel and DC comics. We thus chose two different colors to denote them: red for Marvel, and blue for DC.
Since we are not interested in characters that only appeared in movies adaptations, we keep only those who are represented in at least one comic book.
Moreover, some characters with the same alias can appear multiple times. This is due to the fact that either Marvel or DC decided to keep the name of the character but changed some attributes. We can for example have more than one character with the alias Iron-Man since different people wore the superhero suit. These people are different in their representation, which made us keep all of them as unique characters even if the alias is the same.
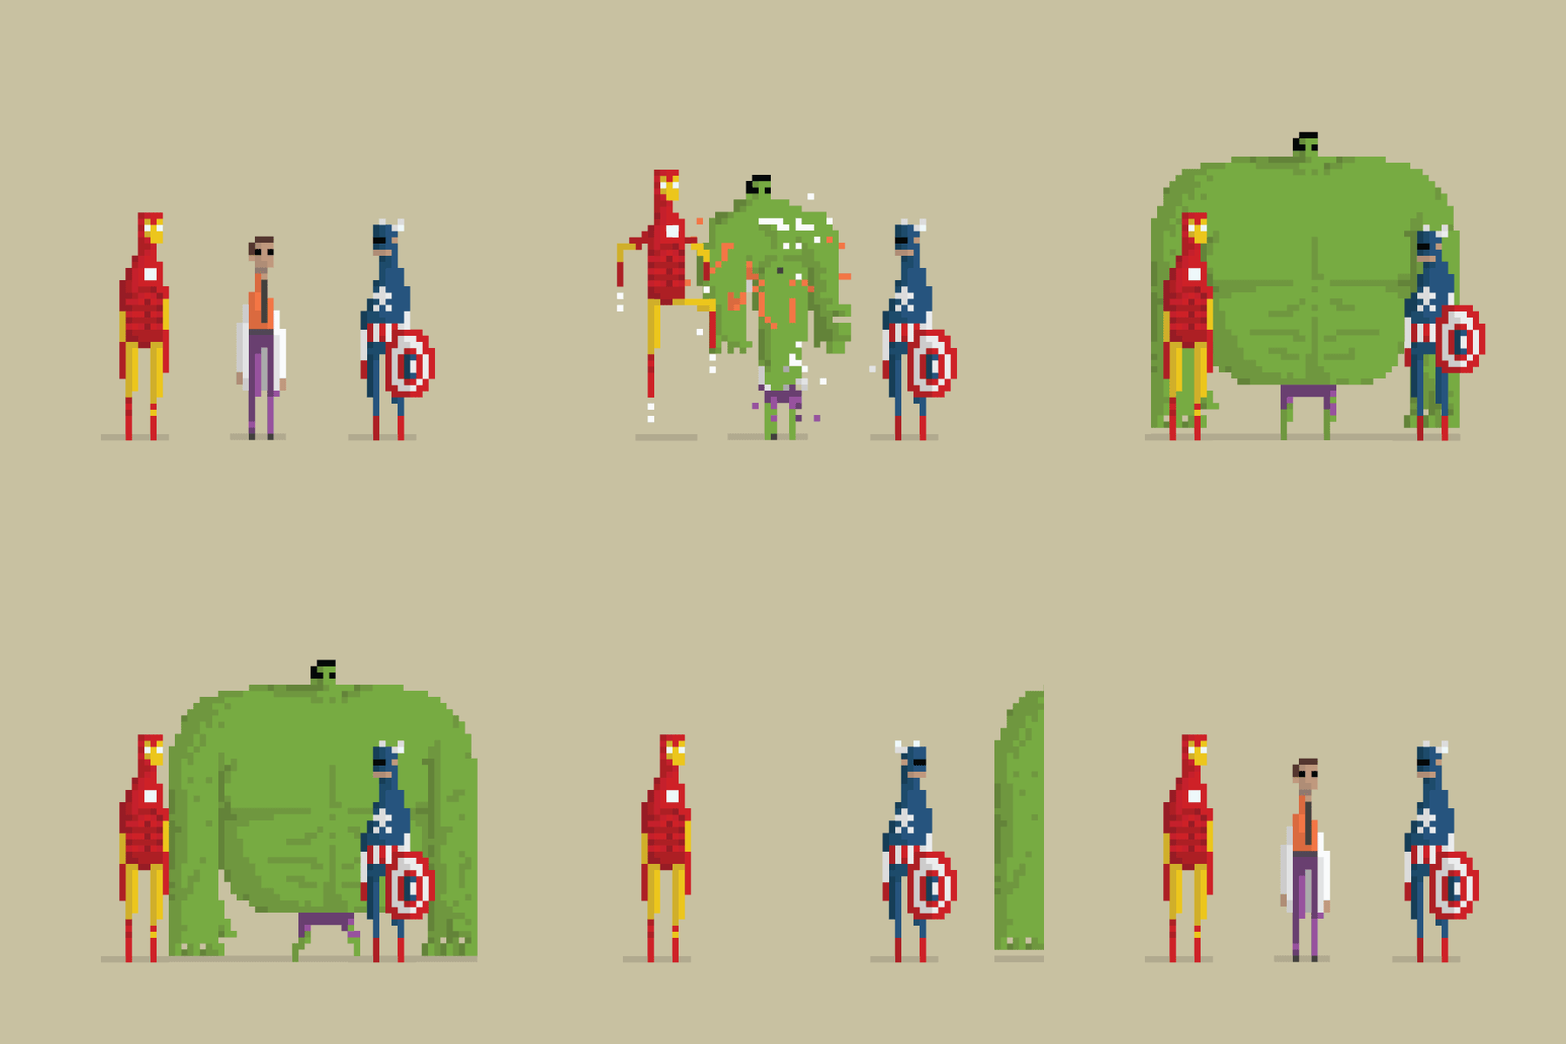
Marvel storylines happen in different universes, which makes an exact same character appear multiple times. For instance, Peter Parker appear in so many different alternate realities that it would be irrelevant to keep them all. We thus only focused on the characters coming from the Earth-616 universe, the most important one according to the number of appearing characters and comics in it.
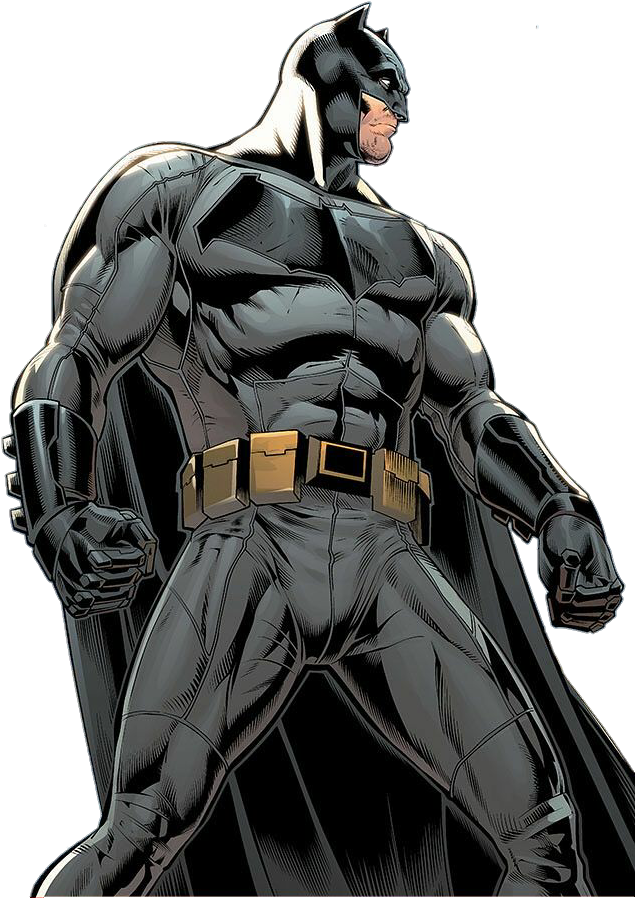
We will start by analyzing the prevailing characteristics over the years. Here are the analyzed attributes: citizenship, marital status, gender, behavior (good, bad or neutral character), occupation, education, height, weight, eyes and hair colors.
Try now to guess what were the most represented characteristics for Marvel and DC characters in 2019! Hover over the cards on the right to get the answer!
The portraits seem quite similar actually, even if DC and Marvel imagine their characters completely apart from each other, and the portraits also seem quite generic.
2019 portrait:
Single
Male
Good
American
Criminal
College
1m80
86kg
Blue eyes
Black hair
2019 portrait:
Single
Male
Good
American
Student
College
1m83
82kg
Brown eyes
Black hair
Let's now look at the data with more depth. Have you ever wondered where did the comics characters come from? Well here's the (not very surprising) answer:
The map speaks by itself. The USA are without any doubt the country where most of the characters are citizens. This is indeed not very surprising since most of the events happen there, which makes sense considering the fact that Marvel and DC comics are American publishers. But three other countries seem to stand out compared to the rest of the world, Russia, Germany and China. This can be explained by war-related issues. Indeed, many events in the comic books happened during the world wars or the cold war, which led to the creation of many stories with multiple villains (for example: Nazis) and heroes (Red Star, a russian superhero who was a "super-agent" for the KGB).
A few things about this map. Some characters have multiple citizenships, and since we didn't want to discard any data, we considered the citizenships as unique, i.e. if a character is french and russian, we increase the value of characters citizenships for both France and Russia. Moreover, many characters don't come from earth. Thus their citizenship isn't represented on this map.
Here's the most appearing types of attributes over time, feel free to explore the data and hover over graphs to display the exact values (you can also click on the legend to choose what category you want to show). The first type of graphs shows the global evolution of dominant categories for all attributes over time. If you want to see exactly the distribution for a specific year, you can refer to the histogram below.
One first interesting thing to notice is that the prevailing characteristics in the early years of Marvel and DC kept being the most used ones over the years. For instance, the two most used eyes colors are blue and brown. And it was the case from the very first characters until nowadays. This suggests that the typical portrait over years isn't really changing, and that Marvel and DC were kind of stuck in the earlier character representations they had. So basically, it seems that the average comic character is and will forever be an 80 kg-American man, 1m80 tall, blue-eyed and black-haired single superhero, ready to save everyones lives. This doesn't really look like the creative comics characters we know about, does it?
Let's now pay attention to the genders proportions evolution. Even if male characters are still largely used, their proportion is decreasing with time. We can clearly see how the male and female curves are leaning towards 50%, the first one decreasing and the second one increasing. If we put the graph in log-scale, more interesting results appear: the proportion of other represented genders like agender is (very) slowly increasing, or is at least starting to have more regular appearances.
So it seems on one hand that almost one exact same portrait is prevailing for both Marvel and DC. But on the other hand, some categories are more and more represented, but it takes time to have a high proportion. We saw the latter with the genders, but why wouldn't it be the same for the other attributes? Funny thing with data: the more you explore it, the more you unravel its hidden secrets, so let's dig deeper!
Sometimes, if you choose to analyze the hole data as it is, you might miss interesting phenomena. We tried to split our portrait analysis according to the behavior attribute, which means that we study the characteristics for good, bad and neutral characters.
The following histogram displays the most represented characteristics for the previously studied attributes, with the proportion of good, bad and neutral characters. Let's see if they are all represented in the same way (and don't forget to hover over the graph to see the exact proportions).
Some attributes show a clear separation depending on the character's behavior, which means that some characteristics are more likely to be attributed to a good than a bad character (or the contrary). Let's for example see the education attribute. For most of the categories, the proportion of bad characters is lower than 25%. This is actually a good thing since an image is conveyed here: superheroes have generally pursued education. Take the example of Iron-man: he went to MIT and have multiple PhDs. If young readers see him as a hero, they can be inspired and try to pursue an engineering career for example. Of course, this can also have a negative impact for people who couldn't, for some reason, access to high level of education or even to college, who would see a correlation between being good and having a high education.
And what if some more random correlations exist between a behavior and an attribute? Try to look at the hair color distribution. It seems that for both Marvel and DC, approximately half of bald people are villains. Calm down, this is probably not a conspiracy theory with a hidden message from the comics creators. It could however create some unintentional connections in the readers mind. This can actually help the writers to more easily show the evilness of a character, but it can also reduce the diversity of good characters and define two different portraits depending on the behavior.
As we did previously, let's add time evolution to our plots and see what happens.
If we look at the evolution of characters citizenships over time, we can see that some periods can be recognized. This is especially the case for the world wars periods which also correspond to the first Marvel and DC comic books: almost all Japanese, Italian and German characters were villains. So the separation becomes more and more clear: superheroes come from America to fight the evilness of Germany and Japan. In times of war, soft power had an impact on citizens, and the US have always tried to convey an image of strength and superiority over the enemies. This phenomenon was observed in many movies, and it is logical to also find it in comic books. However, this portrait didn't really disappear. We can see even years after the wars were over that German characters were still mostly associated to bad characters, which as said before, can sometimes lead the reader to have some unconscious thoughts about German people.
It is clear that all these conclusions must be said cautiously. Sometimes the proportion of good or bad characters is high, but the total number of characters with this category is relatively low. If we look at the evolution of genderfluid characters, we see that they are generally villains. However, the number of genderfluid characters is so small compared to the other genders that we can't really jump into any conclusion.
We will now try a different approach. Instead of looking at the most represented categories, let's analyze the total number of used categories for each year over time. This means that we only take into account the diversity for a specific year, without considering what happened in the years before.
Globally, more and more characters are used in comics each year, and it's the case for both Marvel and DC. We can even see some peaks over a few years which may have different reasons behind them. We can for instance see that in the 1973-1976 period, the number of used characters in the Marvel comics has really increased. This can be explained by the fact that 5 editors-in-chief succeeded each other during that period, and each one of them probably wanted to develop Marvel as much as possible by creating new characters.
But after seeing the increasing number of used characters each year, one musn't quickly jump into conclusions. Indeed, more characters each year doesn't necessarily mean diversity. We can logically think that comics characters won't be used for only a few years and then be abandoned. Storylines can last for so long if they are successfull, see the example of Superman, one of the first DC superheroes (1938) and still amongst the most famous ones today (we'll talk about popularity with more details in the next section).
Let's clarify this with another graph: the distribution of 1st year appearance of characters for a selected year. This means that if you choose for instance 1980 with the slider, you'll see the proportion of used characters in 1980 that appeared from the beginning of Marvel and DC Comics until that selected year (1980). But less talking and more plotting, let's look at the graph.
The first observation is that all along the timeline and even for the most recent years, characters from all the previous years are still used. This confirms our previous hypothesis: even if the number of characters increases over time, many of them were already created before. But the question is how many?
Changing the plot to a linear scale gives another point of view. Indeed, we can see that the distribution is left-skewed, which means that the majority of used characters for a specific year were actually created at maximum 2 to 3 years before, which means that they are relatively new. To go further with the diversity analysis, we must go back to the previous graph to see the evolution of the number of categories for the other attributes, which will tell us how different these newly created characters are.
We can actually see two different tendencies for the two comics publishers. Overall, the number of used categories each year for DC is globally the same, whereas Marvel continuously increases it. We can indeed see that they sometimes have hundreds of different categories for attributes like citizenship, education or even eyes color.
Thus, even though the top categories were the same over years, increasing the total number of categories has probably created diversity. Indeed, if the number of categories for one year is higher than the previous one, they are most likely to be new ones. On the other hand, even if DC has kept a constant number of used categories, we can't for sure say that they aren't new ones, but we can just suppose that it might create less diversity in their characters compared to Marvel.
Saying that a comic character is famous or not might greatly depend on who is to answer the question. To avoid any subjectivity in our analysis, we tried to formulate a mathematical way to compute a "famousness score" (oh no math!). Please don't be scared, we won't get into details here. For the most interested you can check the notebook in the bottom of the page where everything is explained. For the others, let's just say that this score is an arithmetic mean based on the longevity (time between first and last appearance) and the number of appearances of a character. This way, if a character appeared a few times but over a long period, he would get a low appearance score. And on the contrary, if a character appeared many times but on a short period of time, we would have a low longevity score. Since the famousness is based on both scores, a famous character has to appear a high number of times and over a long period.
We decided to split the famousness into three equally divided categories: forgotten (0 < famousness < 33), intermediate (33 < famousness < 66) and famous (66 < famousness < 100). The following histogram shows in what categories the different characters are.
The first thing to notice is the that the number of characters decreases with the famousness score, which means that many characters are forgotten and a few are famous. Moreover, this plot is in logarithmic scale so the difference between famousness categories is actually bigger than visualised on the graph: only 3% of the Marvel and DC characters are considered as famous with our score. In other words, the reason that you remember only a few characters is because Marvel and DC made things that way.
One can wonder why so many characters were forgotten, and a way to see this is to analyze the portraits depending on the behavior.
First, we can see that the most displayed behavior per attribute is the intermediate one. The reason that we don't see so many famous characters in the categories is because they are 5 times fewer than characters with an intermediate famousness score. However, if we have the same reasoning, we could expect to see much more forgotten characters since they constitute almost 78% of all characters. But as their famousness score says, these characters are forgotten. This can be due to the fact that the way they were portrayed didn't have that much success. And since we're only showing the most used categories here, we won't be able to see that many characteristics of characters with a low score. Let's see if isolating periods of time will help us understand what happened.
Actually, a few attributes like citizenship, occupation or hair color, have a relatively high proportion of characters with a low famousness score represented in the earlier periods of time (especially Marvel in 1939-1943). Moreover, this proportion tend to decrease over time and leave place for more famous characters. What we see here is simply the experience that Marvel and DC writers gained over time. The first portraits they designed might not have been very successful, and after trying different combinations over the years, they kind of found the "magic formula" to create popular characters. Of course, this is not a generality and also probably not the only reason we have this distribution.
If we pay attention to the citizenship attribute, we can observe a high rate of forgotten characters born in Germany and Japan. We saw previously in the behavior section that in periods of war, many villains were born in these countries. But actually these bad characters aren't that famous, and people won't really remember them. So maybe after the world wars have ended, readers didn't relate to those villains anymore which made them unpopular, and thus writers tried other portraits for villains. We can carefully extend this principle to other attributes and famousness scores, see for example how since the very first characters, popular ones had blue eyes.
More generally, Marvel and DC tried to adapt their characters to the readers by seeing which ones were most popular. This made the portraits change over time, until great combinations were found to be more successful. You can see in the following graph the characters with the highest famousness score.
We can guess a typical portrait for successful characters. Men occupy the highest ranks (the first female character only comes at the 13th place). Almost all of them are American and have blue eyes, which we can relate to what was said previously. This doesn't mean that any character with these characteristics will be successfull, but it however seems that the most famous ones have very similar portraits.
Our research would be incomplete if we didn't analyze those who give life to all these characters: the writers and editors. They are the key people in the development of comics stories and characters. The attributes we had access to are the gender and the periods of activity which were deduced from the comics (of course since the data is never perfect, some editors and writers don't have these attributes mentionned).
To make the following distributions, we computed the total number of comics edited and written grouped by gender (example: 200 comics in total, 180 of them edited by men and 20 by women, and the same for writers). This will let us see what gender seems to prevail for the comics creators, and later on wonder on the impact its has on the created characters.
Looking at the editors gender distribution down below, we see that for both Marvel and DC comics, there were almost 100% male editors until the 80s. You can hover over the graph to see the exact number of publications and its corresponding proportion.
But starting from that period, we observe that more women became editors-in-chief. This is a direct consequence of the 70s, a period of time when women started to massively go to colleges and graduate schools in the US (known as women's quiet revolution). However, two tendencies are to distinguish between the two comics publishers. DC saw its number of publications edited by women be more and more consistent especially after the 90s. It even reached the point where it exceeded the proportion of male editors. Whereas for Marvel, apart from very few years, 100% of the editors were men.
Let's have a closer look at the periods of activity. Generally, an editor-in-chief stays at least for a few months, and many of them occupied their post for many years. Thus there are relatively a few number of editors. The two following timelines will help us understand the previous results. Please note that the displayed names don't constitute the hole list of editors, otherwise it wouldn't be convenient to read. You can however see the hole data, and if you hover over the periods of activity, you'll see the corresponding editor name. You can moreover double click on one category to display it on its own. Finally, if an editor's gender is marked as "unknown", it means that it wasn't specified in the data.
These timelines give us interesting results. We can see that female editors for Marvel never stayed more than 3 years, which compared to men that have a much longer activity period, explains why there are less comics edited by women. On the opposite, some DC female editors had the opportunity to stay as editors-in-chief for more than 8 years, like Karen Berger (20 years!). Putting this in parallel with the previous graphs, it can explain why DC had a higher proportion of comics edited by women.
Still, the number of editors is limited. So before relating this to the comics characters, let's see what the writers have to say.
So actually, the number of editors-in-chief is relatively low as we saw in the previous timelines. It is on the other hand different for writers, there are much more of them than editors. Even for one comic book there can be multiple writers. This means more data to look at, and more data means more categories! So let's see what we've got.
Well, good news and bad news. As always, bad news first. The observed problem is that even if the percentage of women writers isn't always 0% (comparing Marvel female editors and writers for example), the proportion is still low compared to men. Indeed, the highest observed percentage for both Marvel and DC is barely 8.5%, and we can't even see the tendency increasing over years. This unbalance can affect the creative process that leads to the choice of the portrait for comics characters. Of course, one can not say with certainty that writers will create characters based on their own characteristics, but the influence can still be felt: there are more male characters and more male writers and editors than female, and the two variables are likely to be correlated.
The good news is that the Marvel writers gender distribution is more diverse than the editors one. We can actually see the emergence of other genders than male or female like non-binary, especially in the very recent years (you can double click on the category to see it with more details). This can also be put in parallel with the comics characters genders. Indeed, these writers that are part of gender minorities can try to create diversity for the characters. This may also be related to the recent emergence of new genders that we observed in the very beginning of this analysis. However, it might take time to see these other genders take a bigger part in the comics characters, and a start could be to have writers and editors with more diverse genders.
Let's sum up what we have seen during this analysis. Some characteristics seem to be much more used than others, and it is sometimes the case since the first comics. However, we were able to associate these characteristics to the type of character. Whether he is a villain or a hero, or based on how popular he is, the character's portrait might be different. These differences create diversity, but we also saw that famous characters tend to have similar portraits. Thus we had to question ourselves about the impact of editors and writers on the characters creation process. Maybe the gender imbalance we observed has influenced this choice, and diversity for the creators can lead to more diverse characters.
More generally, we saw that some interesting conclusions could be made on this dataset. Even if the characters aren't real, they can have an impact in some way on the reader and on the way he sees real people with the same characteristics as comics characters. This impact could be either positive or negative, and can't be generalized, but can still be present.
Let's finally say that all the analysis is based on what was seen by means of the gathered data. Since it could be incomplete or vague, we can never be 100% sure about the conclusions, and this is why we always have to be careful when doing this kind of analysis.
This project was made as part of the course of "Applied data analysis" in EPFL.